A simple guide for citizens, administrators and teachers
Many people find themselves looking at a colourful map, full of symbols, lines and levels, and think: “Now what?”
If you are not a GIS technician or an environmental engineer, reading a geospatial map can seem difficult, even intimidating.
But the truth is that maps can speak to everyone. You just need to know what to look for, how to read it and why it is useful.
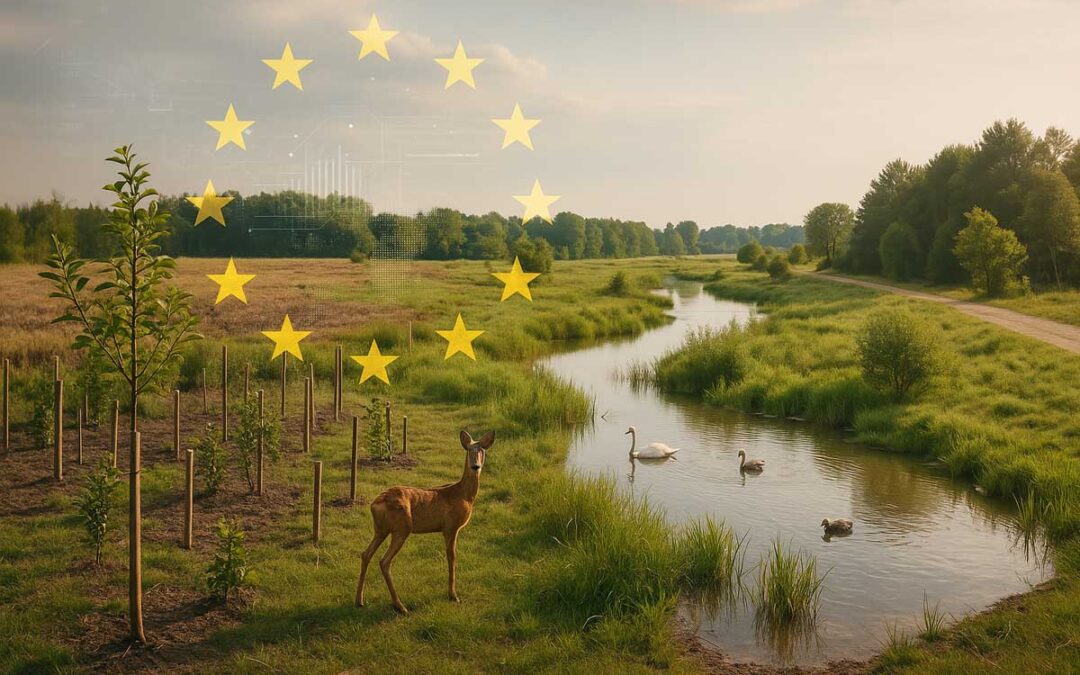
With BIOGIS360, we have precisely this goal: to make environmental data readable, accessible and usable by anyone.
Whether you are a city councillor, a local activist or a secondary school teacher, this guide is for you.
1. The map is not the territory (but it helps us understand it)
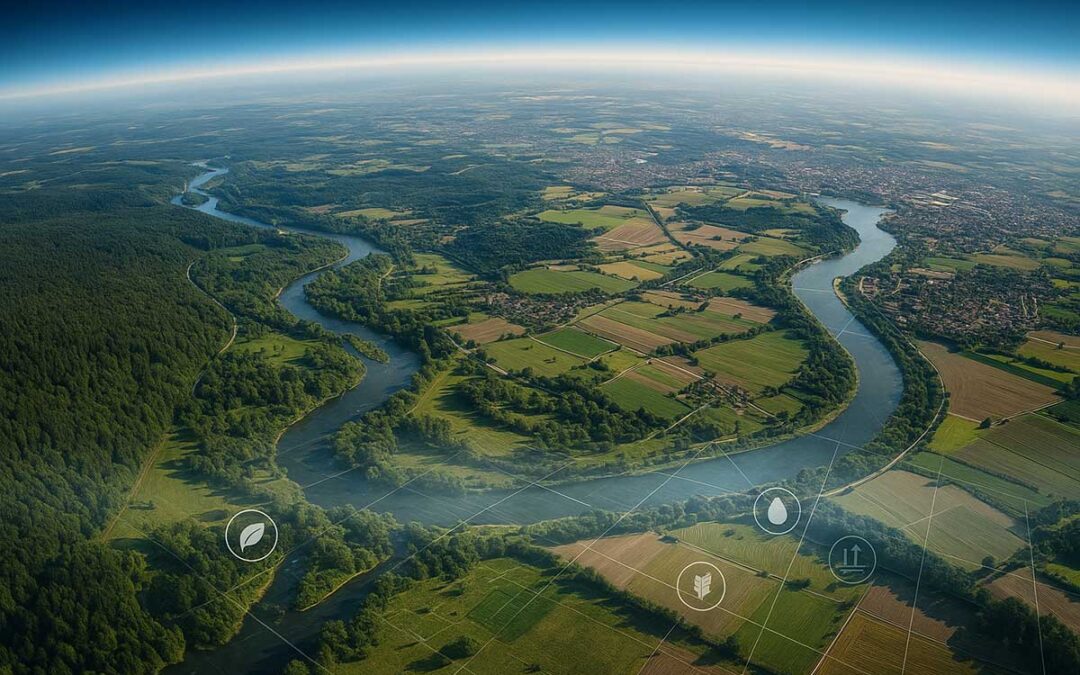
An environmental map represents a transformation of reality, based on georeferenced data. It is not “the truth”, but a key to understanding. Like a good book, it should be read with attention to context.
In BIOGIS360, each map is built on layers: layers of information that you can turn on or off.
Examples:
- Land use (what is on the surface: forests, fields, cities…)
- Vegetation indices (how “alive” the vegetation cover is)
- Areas at risk (landslides, drought, fragmentation)
- Habitats and ecological corridors
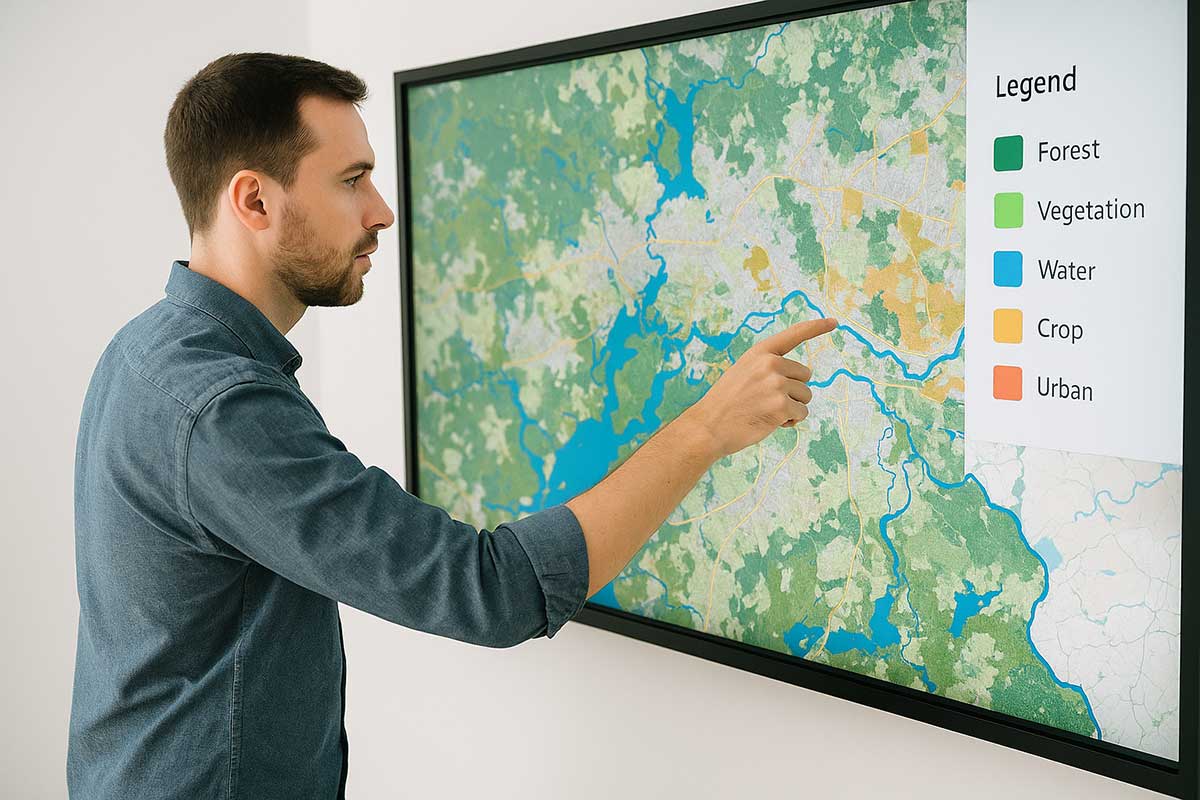
2. Colours and symbols: first impressions count
BIOGIS360 maps always include a legend explaining the meaning of each colour or symbol.
Here are some typical examples:
- Dark green: natural forests or protected habitats
- Light yellow: agricultural areas or crops
- Grey or red: urbanised areas
- Blue: water bodies (lakes, rivers, wetlands)
In addition to colours, dots, lines and grids indicate:
- points of interest (e.g. springs, trails, protected species)
- perimeters of sensitive or protected areas
- infrastructure elements (e.g. roads, pylons)
3. Zoom in, explore, compare
BIOGIS360 is interactive, so you can:
- zoom in to switch from regional to municipal or local
- scale click on an area to get detailed information (e.g. soil type, vegetation status)
- compare two different moments in time (e.g. how it was in 2018, how it is today)
This is a powerful tool for:
- local administrators: to understand where to intervene or where not to build
- teachers: to show children the evolution of an environment
- citizens: to understand whether a change in the landscape is natural or caused
4. You don’t need to be an expert to ask intelligent questions
An environmental map doesn’t tell you what to do, but invites you to ask questions:
- Why has this area become more fragmented over the last three years?
- Why is the vegetation in this area less active in spring?
- Is there a correlation between recent construction and reduced humidity?
In BIOGIS360, you can use the data to ask better questions to technicians, politicians and designers, which is already a big step forward.
5. Maps help to stimulate discussion, not to close the debate.
Maps are not just for “proving something”. They are for understanding together. Showing an environmental map in a council meeting, an association or a school stimulates dialogue and evidence-based discussion.
BIOGIS360 allows you to print maps, export images and generate shareable links. This means you can bring the territory to the table, even without leaving your home.
The 3 most useful features of BIOGIS360 for non-experts
- Simplified time comparison: two dates, one map. To see what has changed.
- Active legend: shows only visible layers, to avoid confusion.
- Quick export to PDF: perfect for reports, projects and communications.
Understanding an environmental map is not a matter of titles or technicalities. It is a matter of attention, curiosity and the right tools.
BIOGIS360 was created precisely for this reason: to bring landscape interpretation into public decision-making, education and everyday life.
And let’s remember: those who read a map see a possible future.
With BIOGIS360, reading a map becomes an intuitive experience: each layer is accompanied by a legend, metadata and interactive tools that help even non-experts understand its meaning. A design choice designed to promote environmental culture, starting with those who are not specialists.