Data catalog
The BIOGIS360 Data Catalog is the informational core of the platform
It is a structured and constantly updated archive that integrates institutional sources, satellite datasets, contributions from Citizen Science, and innovative indicators developed by the project.
It brings together official data on administrative boundaries, biodiversity, protected areas, land use, water resources, hydrogeological risks, and satellite images, organized into thematic groups and made available in interoperable formats. Each dataset is accompanied by clear and standardized metadata, which guarantees its quality, traceability, and compliance with European and international standards.
The Catalog is an operational tool for public administrations, businesses, researchers, and citizens who wish to analyze, plan, and monitor the territory with a view to sustainability and innovation.
Through the Data Catalog, BIOGIS360 contributes to the enhancement of biodiversity, supports integrated planning, and facilitates alignment with European regulations such as the Nature Restoration Law, providing a solid basis for informed decisions and concrete actions.
Thematic Layers
Biodiversity, territory, and environment in an integrated view
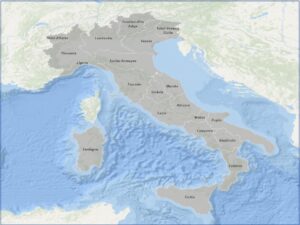
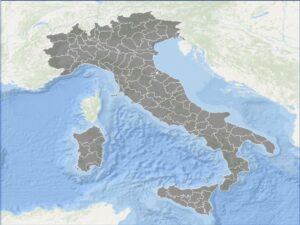
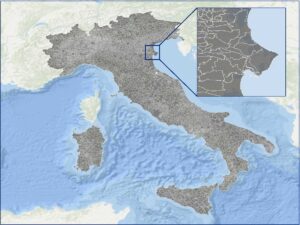
GROUP: ADMINISTRATIVE BOUNDARIES
Regional, provincial, and municipal boundaries 2025
Source: ISTAT
Date: January 1, 2025
Format: shp
Description: The boundaries of administrative units for statistical purposes consist of three hierarchical levels (regions, provinces, and municipalities). The data format is shapefile in the WGS84 reference system. The scale cannot be uniformly certified by ISTAT, as the acquisition bases used (mainly aerial photographs and other cartography) come from different sources and scales that vary between urban and extra-urban areas.
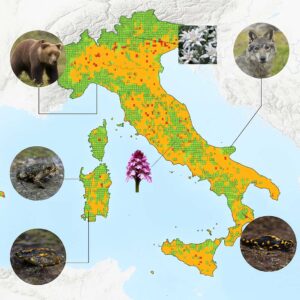
GROUP: BIODIVERSITY
Species: data on distribution, conservation status, and protection of species.
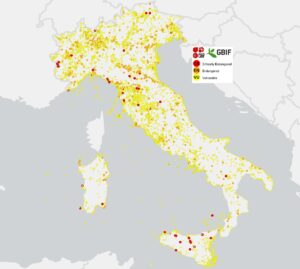
GBIF Red List
Source: GBIF
Date: February 26, 2025
Format: CSV
Description: GBIF (Global Biodiversity Information Facility) data is one of the world’s largest open data resources on biodiversity. The data comes from museums, universities, research institutions, citizen science projects, and other sources. The species occurrence data has been downloaded for Italy only and filtered by: period 2020-2025, kingdom: Animalia and Plantae, IUCN Red List: CR, EN, VU.
Monumental Trees 2025
Source: Ministry of Agriculture, Food Sovereignty, and Forestry
Date: May 2025
Format: CSV
Description: List of monumental trees in Italy (Law No. 10/2013 and Decree of October 23, 2014). The List of Monumental Trees in Italy was established by Departmental Decree No. 5450 of December 19, 2017, pursuant to Article 7 of Law 10/2013, initially comprising 2,407 trees or homogeneous tree systems with completed administrative procedures. The list was subsequently updated through eight decrees between 2018 and 2025, based on regional reports, with a total of 2,555 new entries added. Each update also included changes due to losses of specimens through natural death, felling, or loss of requirements. As of the date of the last update (May 2025), the total number of trees or homogeneous systems registered was 4,749.

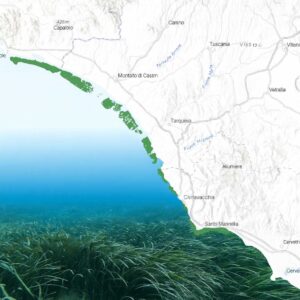
Posidonia oceanic
Source: EMODnet European Commission
Date: February 2021
Format: vector
Description: The dataset shows the distribution of Posidonia oceanica, a marine phanerogam endemic to the Mediterranean Sea, which is essential for the health of coastal ecosystems. It forms underwater meadows known as the “lungs of the Mediterranean,” which perform essential ecological functions: they improve water quality, absorb CO₂, mitigate climate change, stabilize seabeds and beaches, protect coastlines, serve as nurseries and refuges for many marine species, and support fish production. However, these meadows are in decline, and their conservation is considered a priority within the strategies for sustainable development of the “blue economy” in the Mediterranean region.
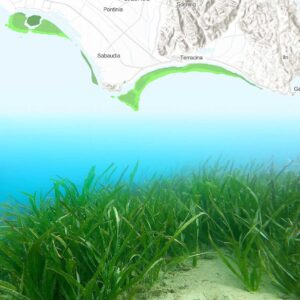
Underwater meadows
Source: EMODnet European Commission
Date: September 20, 2023
Format: WFS
Description: The dataset shows the currently known distribution of seagrass beds in European waters, collected by EMODnet Seabed Habitats. Seagrasses provide essential habitats and nursery areas for many species of marine fauna. There are approximately 72 species of seagrasses belonging to four major groups: Zosteraceae, Hydrocharitaceae, Posidoniaceae, and Cymodoceaceae. Zostera beds and Cymodocea meadows are included in the OSPAR list of threatened or declining habitats. Posidonia beds are protected under Annex I of the EU Habitats Directive.
Habitats: areas potentially or definitely important for biodiversity.
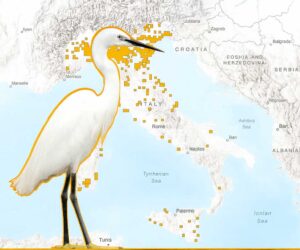
Distribution range of bird species Art. 12 (Birds Directive)
Source: European Environment Agency
Date: March 1, 2022
Format: shp
Description: All EU Member States are required to monitor the birds listed in the Birds Directive (2009/147/EC) and to submit a report every six years on the progress made in implementing the Directive, in an agreed format. The spatial dataset contains gridded data on bird distribution (10 km grid cells), as reported by EU Member States for the period 2013-2018.
Distribution range Species Art. 17 (Habitats Directive)
Source: European Environment Agency
Date: August 27, 2020
Format: shp
Description: All European Member States are required by the Habitats Directive (92/43/EEC) to monitor the habitat types and species listed in its annexes and to submit a report every 6 years in an agreed format. The dataset contains tabular data as reported by Member States for the period 2013-2018; These include habitat areas, population sizes, trends, pressures and threats, and conservation status at the national biogeographical level. It also includes the conservation status and trends in conservation status at the EU biogeographical level, as assessed by the European Environment Agency (EEA) and its European Topic Centre on Biological Diversity (ETC/BD).
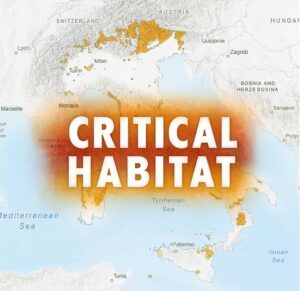
Critical Habitat in Italy (IFC PS6)
Source: OpenDevelopmentMekong
Date: July 9, 2021
Format: ESRI GRID
Description: The dataset identifies areas of probable or potential Critical Habitat, as defined by the International Finance Corporation’s Performance Standard 6 (IFC PS6). The screening level is distributed as a 1 x 1 km² resolution raster dataset and is a composite of 20 global-scale spatial datasets. Unclassified areas indicate a lack of data to assess the likelihood of Critical Habitat presence.
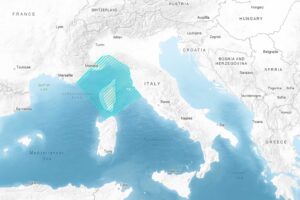
Sanctuary for marine mammals (Pelagos)
Source: National Geoportal – Ministry of Ecological Transition
Date: June 24, 2015
Format: WFS
Description: Law No. 391 of October 11, 2001 – Ratification and implementation of the Agreement on the creation of a sanctuary for marine mammals in the Mediterranean, done at Rome on November 25, 1999. The Sanctuary, also known as the Pelagos Sanctuary, consists of maritime areas located in the internal waters and territorial seas of the French Republic, the Italian Republic, and the Principality of Monaco, as well as adjacent high seas areas.
GROUP: PROTECTED AND RECOGNIZED AREAS
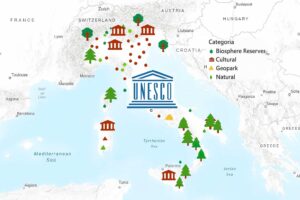
UNESCO Sites
Source: UNESCO
Date: July 24, 2025
Format: CSV
Description: The World Heritage List includes 1,248 properties that are part of the cultural and natural heritage and that the World Heritage Committee considers to be of exceptional universal value. The dataset includes 52 cultural sites, 5 natural sites, 12 geoparks, and 14 biosphere reserves.
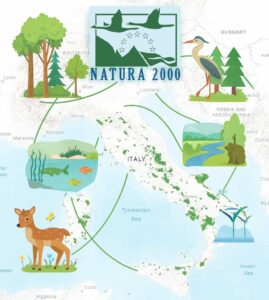
Natura 2000 Network (SIC/ZSC and ZPS)
Source: National Geoportal – Ministry of Ecological Transition
Date: December 13, 2024
Format: WFS
Description: The Natura 2000 network consists of Sites of Community Importance (SCI), identified by Member States in accordance with Directive 92/43/EEC (Habitats Directive), which are subsequently designated as Special Areas of Conservation (SAC), and also includes Special Protection Areas (SPAs) established under Directive 2009/147/EC on the conservation of wild birds. The associated table contains a range of information, including the code, name, area, perimeter, and region of each Natura 2000 site.
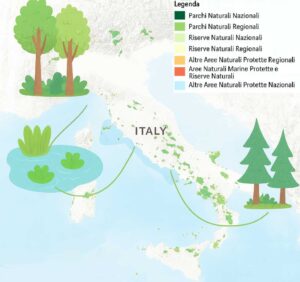
VI Official list of protected areas – EUAP
Source: National Geoportal – Ministry of Ecological Transition
Date: April 10, 2011
Format: WFS
Description: VI Official List of Protected Natural Areas (EUAP). Established under Law 394/91 ‘Framework Law on Protected Areas’, the official list currently in force is that relating to the VI Update approved by Ministerial Decree 27/04/2010 and published in Ordinary Supplement no. 115 to Official Gazette no. 125 of 31/05/2010. According to Law 394/91, protected areas are divided into National Parks (PNZ), Marine Protected Areas (MAR), State Marine Nature Parks (PNZ_m), State Nature Reserves (RNS), Regional Nature Parks and Reserves (PNR – RNR), Submerged Natural Parks (GAPN), and Other Protected Natural Areas (AAPN). The list is compiled and periodically updated by the Ministry of the Environment, Land and Sea Protection – Nature Protection Directorate. Resolution 1:25,000
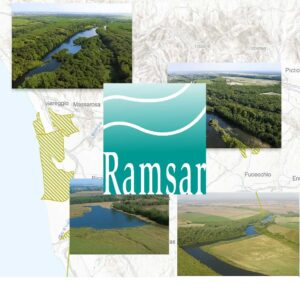
Wetlands of international importance (Ramsar)
Source: National Geoportal – Ministry of Ecological Transition
Date: December 22, 2023
Format: WFS
Description: Ramsar areas are areas of Italian territory that meet the requirements of the international convention on wetlands of international importance, especially as habitats for waterbirds, known as the Ramsar Convention. The Ramsar Convention is an act signed in Ramsar, Iran, on February 2, 1971. The Ramsar Convention was ratified and implemented by Italy with Presidential Decree No. 448 of March 13, 1976, and with the subsequent Presidential Decree No. 184 of February 11, 1987. Under the Convention, wetlands are defined as marshes and swamps, peat bogs or basins, natural or artificial, permanent or temporary, with standing or flowing water, fresh, brackish or salt, including areas of marine water whose depth at low tide does not exceed six meters. Under the Convention, waterbirds are defined as birds that are ecologically dependent on wetlands. The dataset, updated in December 2023, distinguishes between internationally recognized sites and nationally recognized sites whose international recognition is in the process of being finalized.
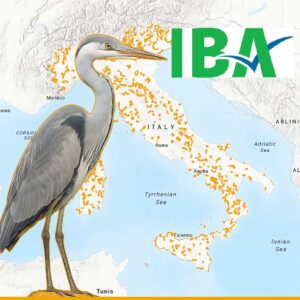
Important Bird Areas (IBA)
Source: National Geoportal – Ministry of Ecological Transition
Date: February 21, 2019
Format: WFS
Description: Important Bird Areas, or IBAs, are areas that play a key role in the conservation of birds and biodiversity. Their identification is part of a global project run by BirdLife International. The IBA project arose from the need to identify uniform, standardized criteria for the designation of SPAs. IBAs have been used to assess the adequacy of the national networks of SPAs designated in Member States. To be recognized as an IBA, a site must have at least one of the following characteristics: it must host a significant number of individuals of one or more globally threatened species; it must be part of a type of area important for the conservation of particular species (e.g., wetlands); it must be an area where a particularly high number of migratory birds concentrate. The resource includes the 2002 inventory of terrestrial IBAs, updated on the basis of studies on the Cory’s Shearwater carried out between 2008 and 2014, which led to the identification of four new Marine IBAs. Resolution 1:25,000
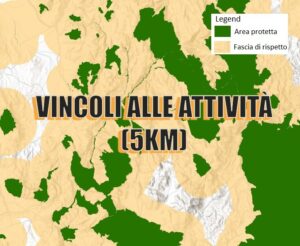
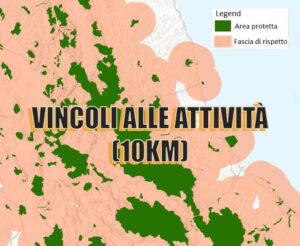
GROUP: BUFFER ZONES AROUND PROTECTED AREAS: RESTRICTIONS ON ACTIVITIES
5 km buffer zone recommended for: Offices, Warehouses, and Low-input Agriculture
Source: UNEP-WCMC (2021), Area of influence of on-site operations, direct impacts; UNEP-WCMC (2022), Area of influence of on-site operations, indirect impacts
10 km buffer indicated for: High-input agriculture, Onshore wind, Construction, Oil and gas (onshore)
Source: Amec Foster Wheeler (2015), Habitat Regulations Assessment: 14th Cycle of Onshore Oil and Gas Concessions. Oil and Gas Authority; UNEP-WCMC (2021), Area of influence of on-site operations, direct impacts; Poore, T. & Nemecek, T. (2018), Reducing the environmental impact of food through producers and consumers. Science, 360, 987–992
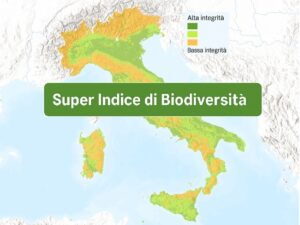
GROUP: BIODIVERSITY SUPERINDEX
Superindice
Source: iptsat
Date: September 2025
Format: GeoTIFF raster
Description: The Super Biodiversity Index is an aggregate spatial indicator developed to support sustainable infrastructure planning in Italy. Calculated on a 1 km raster grid, it integrates and normalizes five ecological indicators (Biodiversity Intactness, Red List Index, Restoration Potential, Total Tree Carrying Potential, and Human Footprint) through weighted overlay in a GIS environment. The index highlights the most ecologically fragile and biodiverse areas, which should be excluded from new developments, and those already compromised, which are potentially suitable for industrial or energy facilities. The data, standardized in ETRS89 / LAEA Europe (EPSG:3035), allows for a systematic and replicable assessment of the ecological suitability of the territory, facilitating the balance between environmental conservation and development.
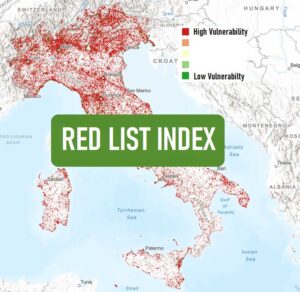
RLI – RED LIST INDEX
Source: iptsat
Date: September 2025
Format: GeoTIFF raster
Description: The Red List Index (RLI) is a synthetic indicator of the conservation status of biodiversity, based on the IUCN Red List of Threatened Species.
It expresses the average level of extinction risk for species in a given territory, assigning increasing weight to threat categories (from “Least Concern” to “Critically Endangered,” with extinct species weighted most heavily). The index ranges from 0 to 1: values close to 1 indicate good biodiversity, while values close to 0 indicate high vulnerability. The RLI raster, normalized and reprojected in ETRS89 / LAEA Europe (EPSG:3035), allows for the spatial analysis of species extinction risk on a kilometer scale, contributing to the ecological assessment of the territory for sustainable planning purposes.
GROUP: LAND USE
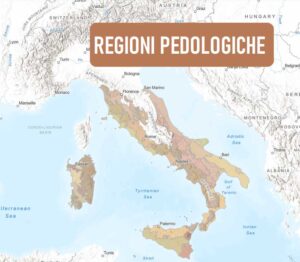
National Atlas of Areas at Risk of Desertification - Soil Regions
Source: National Geoportal – Ministry of Ecological Transition
Date: June 1, 2007
Format: WFS
Description: On December 28, 2001, the Ministry of the Environment and Land Protection funded the Experimental Institute for Soil Study and Protection in Florence for the “Preparation of a National Atlas of Areas at Risk of Desertification” at a scale of 1:100,000 – 1:250,000. The MATTM considers this Atlas to be a preparatory tool for the correct implementation of the National Plan for the Fight against Drought and Desertification, adopted by the Italian State in implementation of the United Nations Convention to Combat Desertification. The mentioned act provides for the participation of the National Institute of Agricultural Economics in its specific areas of expertise. The study area includes Abruzzo, Basilicata, Calabria, Campania, Lazio, Marche, Molise, Puglia, Sardinia, Sicily, Tuscany, and Umbria. Soil regions are the first level in the landscape hierarchy. The information layer of soil regions represents potentially homogeneous areas of soil evolution at the continental level, called “soil regions.”
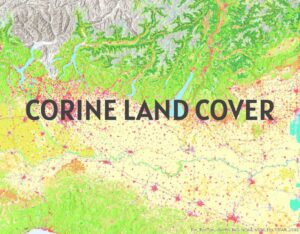
Land use - Corine Land Cover 2018
Source: Copernicus
Date: May 13, 2020
Format: GeoTIFF
Description: Corine Land Cover 2018 (CLC2018) is one of the Corine Land Cover (CLC) datasets produced as part of the Copernicus Land Monitoring Service, relating to the state of land cover and land use in 2018. The CLC datasets are based on the classification of satellite images produced by the national teams of participating countries – EEA member states and cooperating countries (EEA39). The national CLC inventories are then integrated into a continuous map of land cover in Europe. The resulting European database is based on a standard methodology and nomenclature with the following basic parameters: 44 classes in the 3-level CLC hierarchical nomenclature; Minimum Mapable Unit (MMU) for status layers: 25 hectares; Minimum width of linear features: 100 meters.
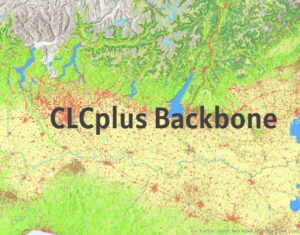
Land cover - Copernicus Backbone
Source: Copernicus Land Monitoring Service (CLMS) / Copernicus Land Monitoring Service – CLCplus Backbone product
Date: 2023
Format: GeoTIFF raster with 10-meter spatial resolution;
Description: CLCplus Backbone is a high-resolution continental land cover product that complements and integrates the Corine Land Cover series. It uses Sentinel-2 image time series, automated methodologies with deep learning classifiers (TempCNN), regional training, and auxiliary data to generate detailed maps of natural and artificial land cover. It is updated every two years (biennially) starting in 2021. Each pixel in the raster shows the dominant land cover class among 11 main classes.
GROUP: HYDROGEOLOGICAL
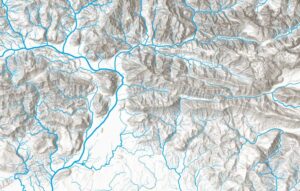
Hydrographic network
Source: National Geoportal – Ministry of Ecological Transition
Date: January 13, 2013
Format: WFS
Description: Vector cartography of the hydrographic network. Scale resolution 1:250000. The data is organized and divided in such a way as to make it easy to view: Main rivers (viewable at scales smaller than 1:3,000,000 and larger than 1:9,000,000); Main and secondary rivers (viewable at scales smaller than 1:1,000,000 and larger than 1:3,000,000); Rivers and streams (viewable at scales smaller than 1:500.000 and larger than 1:1,000,000); Watercourses (viewable at scales smaller than 1:100,000 and larger than 1:500.000); Water features (viewable at scales smaller than 1:100,000 and larger than 1:500.000)
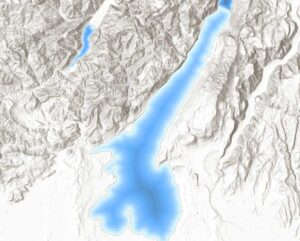
Lakes and other bodies of water
Source: National Geoportal – Ministry of Ecological Transition
Date: January 23, 2013
Format: WFS
Description: Polygonal elements belonging to DBPrior10K representing inland bodies of water such as lakes, lagoons, ponds, reservoirs, etc.
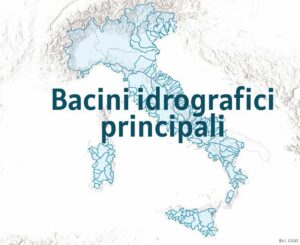
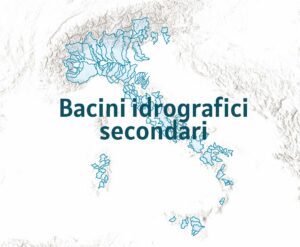
Main and secondary river basins
Source: National Geoportal – Ministry of Ecological Transition
Date: January 23, 2013
Format: WFS
Description: Based on the information layer of river basins at a national scale of 1:250,000, consistent with the hydrographic network, the river basins and sub-basins of watercourses flowing into the sea with an area greater than or equal to 200 km² have been identified in accordance with Legislative Decree 152/99 and subsequently with the Water Framework Directive 2000/60/EC. Resolution 1:10000
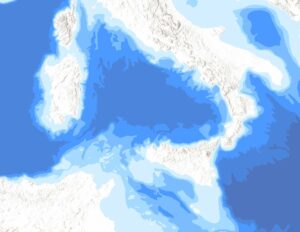
Bathymetry of the seas
Source: National Geoportal – Ministry of Ecological Transition
Date: January 23, 2013
Format: WFS
Description: Information layer representing the polygons of Italian sea depths. Resolution 1:5,000,000
GROUP: THEMATIC CARTOGRAPHY
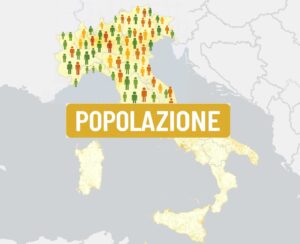
GHS population grid (R2023)
Source: European Commission – Joint Research Center (JRC), GHSL – GHS-POP R2023A
Date: 023 (release); time coverage: 1975–2030 (in 5-year intervals)
Format: GeoTIFF raster; resolutions: 100 m
Description: Multi-temporal raster grid of the global resident population, developed by the European Commission’s Joint Research Center (JRC) as part of the Global Human Settlement Layer (GHSL). The GHS-POP R2023A dataset provides a spatially explicit population estimate for the years 1975, 1980, 1985, 1990, 1995, 2000, 2005, 2010, 2015, 2020 (observed) and 2025, 2030 (projected), at five-year intervals. The population estimates are derived from official census data (GPWv4.11 – CIESIN) disaggregated within census units using models based on the distribution of built-up areas and their volume, obtained from GHSL (GHS-BUILT) products. The result is a globally consistent and comparable representation of the distribution of the residential population over the period 1975–2030. The data is available in GeoTIFF raster format and is designed for applications in spatial planning, demographic analysis, urban management, SDG monitoring, and urban expansion studies.
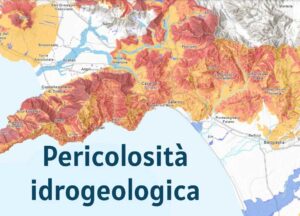
PAI - Hydrogeological hazard
Source: National Geoportal – Ministry of Ecological Transition
Date: January 23, 2013
Format: WFS
Description: PAI hydrogeological hazard refers to Hydrogeological Structure Plans and their hazard maps, which classify areas according to the probability of being affected by a flood, landslide, or avalanche. The standard classifications for hazard, also defined by Legislative Decree 49/2010, are usually linked to scenarios of low, medium, and high probability of flooding, based on specific studies by regional and national bodies.
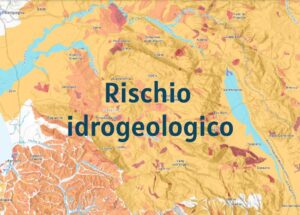
PAI - Hydrogeological risk plan
Source: National Geoportal – Ministry of Ecological Transition
Date: January 23, 2013
Format: WFS
Description: PAI hydrogeological risk refers to the Hydrogeological Structure Plans and their risk maps, which classify areas based on the expected damage from a flood, landslide, or avalanche. The standard risk classifications, also defined by Legislative Decree 49/2010, are usually linked to scenarios of moderate or zero risk, medium risk, high risk, and very high risk.
GROUP: SATELLITE DATA
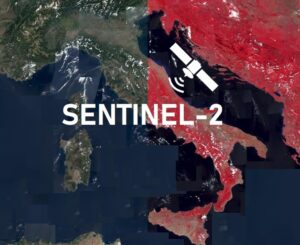
Sentinel-2 Views
Source: ArcGIS / Esri – “Sentinel2 (ImageServer)” service that draws from the Sentinel-2 collection on AWS.
Date: Includes images acquired in the last 14 months, updated daily. The Level-1C dataset has been available globally since June 2015.
Format: Dynamic image service (“Image Service”) in ArcGIS REST, not strictly WMS/WFS.
Description: This is a global layer of Sentinel-2 images (Level-1C, Top-of-Atmosphere) covering almost all land masses from 65.4° S to 72.1° N, including coasts, large islands, and enclosed seas. Images are selected based on criteria such as cloud cover, acquisition date, and tile ID. Predefined and custom views are available (e.g., Natural Color, Color-Infrared, NDVI, NDBI, etc.). The service is useful for applications such as environmental monitoring, land use change, precision agriculture, emergencies, forest analysis, urban expansion, and fire area estimation.
Wayback imagery
Source: Esri / ArcGIS Living Atlas — “World Imagery Wayback” service (an archived version of World Imagery basemaps)
Date: Archived versions start from February 20, 2014 onwards. The service is updated regularly, each time a new version of the World Imagery basemap is released. Published versions are stored in the “wayback” archive. As of December 14, 2018, there were already 89 archived versions.
Format: raster tile service (tile layers) for basemaps.
Description: World Imagery Wayback is a historical archive of versions of the Esri “World Imagery” basemap. It allows you to view past versions of the ESRI basemap—as they were published on previous dates—to observe changes over time (land use, urban development, land cover, etc.). Each version of the layer has metadata showing the publication date of the Wayback layer, and pop-ups also show the image capture date (when available) for the specific point selected. Useful for historical assessments, visual comparison, searching for images with fewer clouds/better conditions, and analyzing territorial change.
Explore the Layers
Access integrated geospatial data now and discover how biodiversity, territory, and the environment connect in a unified vision.